Signal acquisition
Required hardware characteristics
There are myriad of sensors for respiration recording, some of which are fiber optic, resistive, impedance, capacitive, accelerometer, gyroscope, magnetometer, differential pressure, microphone optical, triboelectric nanogenerator, nanocrystal and nanoparticles sensor.
There are various methods to record respiration, two of which are of interest: chest wall movement and modulation of cardiac activity (fig. 2) [1].
Differences in thoracic diameter caused by the chest-wall movement can be detected and analyzed in various ways. Three major approaches introduced in [2] are as follows:
- measurement of chest wall strain
- resistive sensors
- capacitive sensors
- inductive sensors
- fiber-optic sensors
- measurement of transthoracic impedance change
- impedance pneumography
- measurement of thorax 3D movements (IMU sensors):
- accelerometer
- gyroscope
- magnetometer
Strain sensors detect the changes in the geometrical shape of the thorax or abdomen during respiration. The technology applied in resistive sensors is based on piezoelectric effect [3], while capacitive sensors measure the alteration of permittivity and distance between two electrodes on opposite sides of the chest-wall [4]. Inductive sensors monitor the variation of an oscillator wave frequency produced by respiratory movements [5]. Fiber-optic sensors can also be embedded for respiration monitoring, especially in MRI settings [6].
Furthermore, Transthoracic Impedance plethysmography (TI-PPG) is another method to monitor the changes in tissue volume while breathing. Respiratory components can be identified and extracted from ECG and PPG signals to calculate the breathing rate.
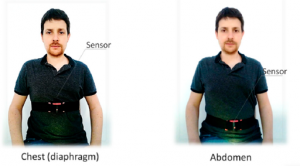
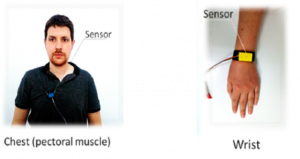
Due to minimizing motion artifacts, it is preferred to place it on the thorax [7]. The anteroposterior diameter of the chest has more movement during the expansion/contraction than the Mediolateral diameter. Therefore, the sensor should be placed on the anterior chest wall to have a better signal. As seen in Figure 1 Bitalino manual guide for (PZT) has proposed the anatomical position of the 8th to 10th ribs.


Sensor placement and Recording protocol
The chest (diaphragm) and abdomen are the most common placement for respiration monitoring [8]. The other possible places are the wrist, upper chest (pectoral muscle), and back. In wearable studies, most cases have measured the respiration signal from the chest or abdomen.

Signal processing
Waves and characteristics
Breathing is a vital physiological act that occurs beyond our consciousness. It consists of two individual actions: Inspiration and Expiration. Through inspiration, we inhale Oxygen(O2) and transport it to the lungs, while through expiration Carbon dioxide (CO2) is transported out from the lungs to the environment [9].
The mechanical act of respiration is done by the means of an important muscle named the Diaphragm. It is a dome-shaped muscular layer located under the lungs. When it contracts it transforms into a transverse layer causing pressure increase in the thoracic area, expansion of the rib cage, and consequently entrance of air to the lungs. Reversely, relaxation of the diaphragm contributes to passive transduction of air out (Figure 1). Ventilation, on the other hand, refers to the underlying mechanism for the exchange of O2 and CO2 at the cellular level. Intercostal muscles, neck muscles, and abdominal muscles are also crucial for deep inhalation and exhalation [10].

A normal rate of respiration in humans is between 12-20 to maintain sufficient oxygenation. To maintain Hemostasis, any metabolic changes due to lack of oxygen or excess CO2 in the peripheral blood are sensed by chemoreceptor centers and regulate the breathing rate to the optimum level. Chemoreceptors are specialized neurons located inside blood vessels and CNS. They send signals to the respiratory center of the brain in the brainstem to increase or decrease the breathing pattern. Breathing pattern comprises breathing rate and depth [11].
Although respiration is automatic, it can be consciously controlled. Other centers responsible for the modulation of breathing patterns are the cortex and limbic system. Voluntary breath holding or exhalation while speech or singing is altered by cortical intervention on the respiration system. Emotions like anxiety, excitation and fear are also capable of generating different breathing patterns. Laughing, yawning, sobbing are examples of irregularity in breathing rhythm caused by emotions [12]. (Figure 5)

A signal beat wave description
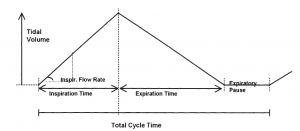
Respiration is in the range of 0.1 to 0.5 Hz i.e., 6 to 30 breaths per minute (BPM) [13]. As seen in figure 6, different characteristics can be extracted from breathing signal such as inspiration and expiration time, expiratory pause, total cycle time and inspiration flow rate. Tidal value also, can be estimated from the maximum value of amplitude of the respiratory signal. Besides these features, other characteristics are listed in the next section.
Signal characteristics
A respiration cycle consists of various components. To medically assess the breathing quality each of these components should be evaluated. Some respiratory monitoring methods are capable of extracting particular components while others are not. For non-medical research purposes such as emotion recognition, respiratory pattern and rate are sufficient. Components derived from a PZT waveform are listed below [15]:
- Respiratory cycle (Total breath duration): the period of time from the beginning of the inspiration process until the end of expiration.
- Breath volume (Tidal volume): volume of inhaled/exhaled air during a respiratory cycle.
- Moment ventilation (Minute ventilation): volume of air inhaled in one minute.
- Inspiratory time (Ti)
- Expiratory time (Te)
- post inspiratory pause
- post expiratory pause
- inspiratory duty cycle time DTCY (Ti /Ttot): The DTCY is an important quantitative indicator for estimating the consistency of the RC [15].
- mean inspiratory flow rate (Vt /Ti)
- the percentage of rib cage contribution to Vt (RC/Vt)


Signal preprocessing
One of the most imperative steps of signal processing is preprocessing of the signal. Studies have shown that the frequency of respiration ranges from 0.2 in sleep to 0.5 during exercise. Given the 3 breaths per minute as a standard, a high pass filter (HPF) with a cut-off frequency of 0.05 Hz can be used which ensures the removal of baseline oscillations (baseline wander (BW)). A low-power amplifier and a low-pass filter with a 5 Hz cut-off frequency can be applied to removes noises and artifacts caused by motion. Additionally, using a low pass filter (LPF) with a cut-off frequency of o.5 Hz [13] or 0.7 Hz (42 breaths per minute) removes high-frequency artifacts such as ECG [16]. Powerline inference (PLI) also is another artifact that can be removed by a notch filter.

Physiological feature extraction
Peak detection: peak detection is a troublesome stage in the presence of the noise. Different local optima detection is usually used and then by thresholding and comparing the results, the selected peaks are respiration peaks. From the maximum-minimum values, parameters such as respiratory period ( ), as well as inspiratory ( ) and expiratory ( ) time can be detected.
Zero-crossings: In order to determine the number of fluctuations and respiration rate, one way is to measure zero-crossings. There are many challenges in this way, including zero-crossing detection in noisy signal, the effect of outliers in threshold of zero-crossing, trends in a breathing signal.
Frequency analysis: in order to obtain the frequency domain parameters several studies use finding peaks in the spectrum or power spectral density (PSD), frequency, or amplitude modulation. Because the resolution in the time and frequency domains is inversely proportional, the longer the time-domain window for Fourier transform calculation, the more accurate peaks may be detected.
One of the problematic noises in respiratory signal is motion artifact which can occur due to the movements in the sensing device or movement of the subject for instance breathing signal recording during walking. Sudden movements also may appear as a peak near to the respiration frequency in the frequency domain.
Wavelet transform: The other approach to detect peaks and zero-crossing in respiration signal is to decompose the signal using wavelet or its variant multi-resolution analysis (MRA). Since being of low frequency, the respiration signal can be reconstructed from the level of interest of approximation coefficients. (For example, 6th out of 6, 11th out of 12 or 3rd out of 4 decomposition levels have been used for RR calculation).
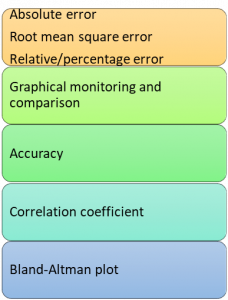
Evaluation parameters: Evaluation parameters for breathing signal are as follow:
The output waveform signal is usually made up of sinusoidal maximum and minimum peaks. The upgoing slope is correlated with inhalation the downward slope is correlated with exhalation. The time distance between two consecutives maximum (or minimum) peaks is interpreted as a respiratory(breath) cycle. The voltage of maximum peak can be correlated with the volume of air entered during inhalation and shows the depth of breathing. Respiratory features can be calculated by the following formula:
- Respiratory rate (RR) [17]: As told before, the most important feature especially for emotion recognition is respiratory rate. Respiratory rate (RR) is the number of breaths (inspiration and expiration) in one minute. Here, RR and some of other features that can be measured from RR are shown.

Tw = selected period of time during which the signal is collected
NP = number of positive peaks for the selected period of time
- Breath volume (BV) (12):

∅ = real numbers on a given respiratory wave and points as to g in Figure 6.
- Minute ventilation (MV) (12):
MV = RR × BV
- DTCY (12):

TI = inspiration time
TE = expiration time
Ttot = total respiratory time
To determine whether the calculated data is in the normal physiological range, it must be compared reference normal numbers. At rest, valid respiratory rate for adults under 65 is between 12 and 20 per minute [18]. However, acquired numbers must be interpreted in accordance to subject’s condition. For instance, while RR higher than 20 are registered as tachypnea (rapid breathing), during physical exercise, recorded numbers may pass 60 breaths per minute [19].
| Resting normal range | |||
| RR | 12-20 | <12 = bradypnea (slow breathing) >20 = tachypnea (fast breathing) | |
| DTCY | 1/3 of RC |
Respiratory rate derived from ECG and PPG
The process of respiration can modulate the signals recorded to monitor heart activity. Hence, by analysis of those signal it is possible to extract respiratory parameters [20]. This method is an optimum technique for wearable devices, as there is no need to add a new sensor.
During the inspiration, heart rate frequency increases and decreases during the expiration. The alteration of heart rate frequency is recognized as the respiratory sinus arrythmia (RSA) and correlates with autonomous nervous system (ANS) activity [21]. In addition, ECG derived respiratory rate (EDR) is a method based on detecting the change in the heart axis caused by breathing movements [22], which is also explored by authors in [23-26]. Moreover, single-lead EDR is investigated by previous research work [27, 28].
During respiration the PPG signal is affected in both frequency [21] and amplitude [29]. Also, signal baseline [30] and wave width [31] are altered due to changes in intervascular pressure and vascular stiffness, respectively.
RSA method for detection of respiratory rate is preferred according to one lead acquisition and ANS activity correlation.
Applications
Cardiac vagal activity is strongly modulated by breathing pattern. During inspiration and second half of expiration vagal activity is inhibited, while during the first half of expiration the activity of vagal neurons increases. This is interaction between cardiac and respiratory activity is referred to as “Cardiorespiratory synchronization”. Accordingly, asynchrony in heart and breathing can be an early sign of Autonomic dysfunction. Stress, anxiety and other psychological conditions that induce sympathetic hyperactivity can reduce this synchrony and exhibit higher heart rate and irregular breathing patterns. On the other hand, changes in breathing depth and rate may influence the autonomic system [32]. Slower, deeper breathing cause decrease in sympathetic activity and relaxation. Latest studies suggest that respiration can affect cognitive processes in the brain and corticomuscular coherence, as well (32-34).
Respiration pattern detection is a promising method for emotion recognition. Different emotional states in terms of arousal and valence are correlated with specific breathing patterns [12, 35]. Positive emotions can induce increased breathing pattern variability and lower tidal volume and inspiratory cycle time [36], whereas, negative emotions such as fear, anger, and anxiety exhibit faster, shallower breathing [36, 37]. In addition, breathing irregularity, which can be assessed by the coefficient of breath-to-breath variability, has a correlation with emotional conditions [36]. Real time measurement is needed in order to analyze emotions through respiration. To this end, a suitable technique for real time acquisition of respiration, as those mentioned in this paper, must be applied [38].
Emotion Recognition
Emotion recognition is crucial in joint action between humans and computers. In the below diagram this interaction is shown (fig. 10). As seen, in order to achieve a human-machine joint action, it is important to have emotional attunement, i.e., recognizing, understanding and engaging ones’ emotional state between human and embodied conversational agent (ECA), Robot or Avatar.


Here are a bunch of various classification methods used for emotion classification in the literature:
- KNN
- Regression Tree
- Bayesian Networks
- SVM
- Canonical Correlation Analysis (CCA)
- Artificial Neural Network (ANN)
- Linear Discriminant Analysis (LDA)
- Marquardt Back Propagation (MBP) [39]
- Adaptive Neuro-Fuzzy Interference System (ANFIS) [41]
Review of previous works on emotion recognition using physiological signals


Recent studies show that multimodal biosignals can be a more complete representation for emotional state monitoring [40]. For instance, in the below table, one can see the features from HRV, Respiration, and Blood Volume Pressure (BVP) used for stress recognition [40].
References
[1] Massaroni C, Nicolò A, Lo Presti D, Sacchetti M, Silvestri S, Schena E. Contact-based methods for measuring respiratory rate. Sensors. 2019 Jan;19(4):908.
[2] Massaroni C, Nicolò A, Lo Presti D, Sacchetti M, Silvestri S, Schena E. Contact-Based Methods for Measuring Respiratory Rate. Sensors. 2019;19(4):908.
[3] Rao SS, Sunar M. Piezoelectricity and Its Use in Disturbance Sensing and Control of Flexible Structures: A Survey. Applied Mechanics Reviews. 1994;47(4):113-23.
[4] Grlica J, Martinović T, Džapo H, editors. Capacitive sensor for respiration monitoring. 2015 IEEE Sensors Applications Symposium (SAS); 2015 13-15 April 2015.
[5] Fiamma M-N, Samara Z, Baconnier P, Similowski T, Straus C. Respiratory inductive plethysmography to assess respiratory variability and complexity in humans. Respiratory Physiology & Neurobiology. 2007;156(2):234-9.
[6] Witt J, Narbonneau F, Schukar M, Krebber K, Jonckheere JD, Jeanne M, et al. Medical Textiles With Embedded Fiber Optic Sensors for Monitoring of Respiratory Movement. IEEE Sensors Journal. 2012;12(1):246-54.
[7] Atalay O, Kennon WR, Demirok E. Weft-knitted strain sensor for monitoring respiratory rate and its electro-mechanical modeling. IEEE Sensors Journal. 2014;15(1):110-22.
[8] Vanegas E, Igual R, Plaza I. Sensing systems for respiration monitoring: A technical systematic review. Sensors. 2020 Jan;20(18):5446.
[9] Hlastala MP, Berger AJ. Physiology of respiration: Oxford University Press; 2001.
[10] Ratnovsky A, Elad D, Halpern P. Mechanics of respiratory muscles. Respiratory Physiology & Neurobiology. 2008;163(1):82-9.
[11] Grossman P. Respiration, Stress, and Cardiovascular Function. Psychophysiology. 1983;20(3):284-300.
[12] Jerath R, Beveridge C. Respiratory Rhythm, Autonomic Modulation, and the Spectrum of Emotions: The Future of Emotion Recognition and Modulation. Front Psychol. 2020;11:1980.
[13] Aqueveque P, Gómez B, Monsalve E, Germany E, Ortega-Bastidas P, Dubo S, Pino EJ. Simple Wireless Impedance Pneumography System for Unobtrusive Sensing of Respiration. Sensors. 2020 Jan;20(18):5228.
[14] Haruki Y, Homma I, Umezawa A, Masaoka Y, editors. Respiration and emotion. Tokyo: Springer; 2001 Jul.
[15] Raji RK, Miao X, Wan A, Niu L, Li Y, Boakye A. Knitted piezoresistive smart chest band and its application for respiration patterns assessment. Journal of Engineered Fibers and Fabrics. 2019;14:1558925019868474.
[16] Moeyersons J, Morales J, Seeuws N, Van Hoof C, Hermeling E, Groenendaal W, Willems R, Van Huffel S, Varon C. Artefact detection in impedance pneumography signals: A machine learning approach. Sensors. 2021 Jan;21(8):2613.
[17] Allataifeh A, Al Ahmad M. Simultaneous piezoelectric noninvasive detection of multiple vital signs. Sci Rep. 2020;10(1):416.
[18] Cretikos MA, Bellomo R, Hillman K, Chen J, Finfer S, Flabouris A. Respiratory rate: the neglected vital sign. Medical Journal of Australia. 2008;188(11):657-9.
[19] Soffler MI, Hayes MM, Schwartzstein RM. Respiratory sensations in dynamic hyperinflation: physiological and clinical applications. Respiratory care. 2017;62(9):1212-23.
[20] Charlton PH, Birrenkott DA, Bonnici T, Pimentel MAF, Johnson AEW, Alastruey J, et al. Breathing Rate Estimation From the Electrocardiogram and Photoplethysmogram: A Review. IEEE Reviews in Biomedical Engineering. 2018;11:2-20.
[21] BERNTSON GG, CACIOPPO JT, QUIGLEY KS. Respiratory sinus arrhythmia: Autonomic origins, physiological mechanisms, and psychophysiological implications. Psychophysiology. 1993;30(2):183-96.
[22] Moody GB, Mark RG, Bump MA, Weinstein JS, Berman AD, Mietus JE, et al. Clinical validation of the ECG-derived respiration (EDR) technique. Computers in cardiology. 1986;13(1):507-10.
[23] Lázaro J, Alcaine A, Romero D, Gil E, Laguna P, Pueyo E, et al. Electrocardiogram derived respiratory rate from QRS slopes and R-wave angle. Annals of biomedical engineering. 2014;42(10):2072-83.
[24] Bailon R, Sornmo L, Laguna P. A robust method for ECG-based estimation of the respiratory frequency during stress testing. IEEE Transactions on Biomedical Engineering. 2006;53(7):1273-85.
[25] Birrenkott DA, Pimentel MAF, Watkinson PJ, Clifton DA, editors. Robust estimation of respiratory rate via ECG- and PPG-derived respiratory quality indices. 2016 38th Annual International Conference of the IEEE Engineering in Medicine and Biology Society (EMBC); 2016 16-20 Aug. 2016.
[26] Sobron A, Romero I, Lopetegi T, editors. Evaluation of methods for estimation of respiratory frequency from the ECG. 2010 Computing in Cardiology; 2010 26-29 Sept. 2010.
[27] Boyle J, Bidargaddi N, Sarela A, Karunanithi M. Automatic detection of respiration rate from ambulatory single-lead ECG. IEEE Transactions on Information Technology in Biomedicine. 2009;13(6):890-6.
[28] Sharma H, Sharma KK, Bhagat OL. Respiratory rate extraction from single-lead ECG using homomorphic filtering. Computers in Biology and Medicine. 2015;59:80-6.
[29] Meredith DJ, Clifton D, Charlton P, Brooks J, Pugh CW, Tarassenko L. Photoplethysmographic derivation of respiratory rate: a review of relevant physiology. Journal of Medical Engineering & Technology. 2012;36(1):1-7.
[30] Nitzan M, Faib I, Friedman H. Respiration-induced changes in tissue blood volume distal to occluded artery, measured by photoplethysmography. Journal of Biomedical Optics. 2006;11(4):040506.
[31] Lázaro J, Gil E, Bailón R, Mincholé A, Laguna P. Deriving respiration from photoplethysmographic pulse width. Medical & Biological Engineering & Computing. 2013;51(1):233-42.
[32] Philippot P, Chapelle G, Blairy S. Respiratory feedback in the generation of emotion. Cognition and Emotion. 2002;16(5):605-27.
[33] Kluger DS, Gross J. Depth and phase of respiration modulate cortico-muscular communication. NeuroImage. 2020;222:117272.
[34] Karalis N, Sirota A. Breathing coordinates limbic network dynamics underlying memory consolidation. Available at SSRN 3283711. 2018.
[35] Homma I, Masaoka Y. Breathing rhythms and emotions. Experimental physiology. 2008;93(9):1011-21.
[36] Boiten FA. The effects of emotional behaviour on components of the respiratory cycle. Biological Psychology. 1998;49(1):29-51.
[37] Masaoka Y, Homma I. The effect of anticipatory anxiety on breathing and metabolism in humans. Respiration Physiology. 2001;128(2):171-7.
[38] Oh S, Lee JY, Kim DK. The Design of CNN Architectures for Optimal Six Basic Emotion Classification Using Multiple Physiological Signals. Sensors (Basel). 2020;20(3).
[39] Jerritta S, Murugappan M, Nagarajan R, Wan K. Physiological signals based human emotion recognition: a review. In2011 IEEE 7th international colloquium on signal processing and its applications 2011 Mar 4 (pp. 410-415). IEEE.
[40] Giannakakis G, Grigoriadis D, Giannakaki K, Simantiraki O, Roniotis A, Tsiknakis M. Review on psychological stress detection using biosignals. IEEE Transactions on Affective Computing. 2019 Jul 9.
[41] Egger M, Ley M, Hanke S. Emotion recognition from physiological signal analysis: A review. Electronic Notes in Theoretical Computer Science. 2019 May 4;343:35-55.
