Features of HRV
There are two types of HRV analysis methods: linear analysis and nonlinear analysis. The most widely used methods can be grouped into the time domain and the frequency domain. Time domain methods are based on the NN intervals (normal RR intervals) and Frequency domain methods assign bands of frequency and then count the number of NN intervals that match each band. Spectral analysis is a noninvasive method for understanding autonomic nervous system activity and has been applied to the assessment of cardiovascular control. In table 8 and 9, time domain and frequency domain variables are defined. Nonlinear methods are used because of the complexity of the mechanisms regulating heart rate. Some non-linear variables are listed in table 10 as well.

Time domain analysis
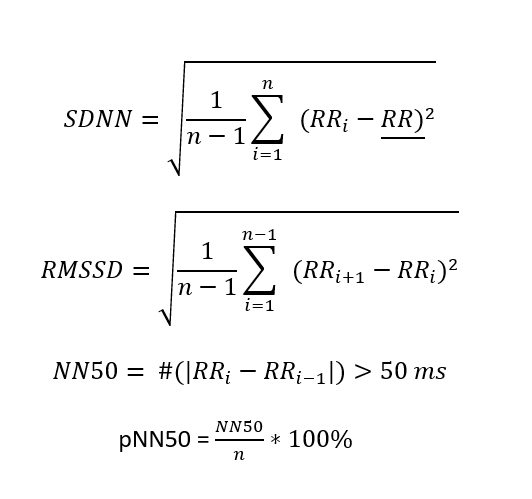
As seen in table 6, time-domain variables, a brief description and their relation to sympathetic and parasympathetic system are itemized. Some of the most common time-domain statistical variables of HRV which are related to the RR intervals deviation are measured by the following equations. is the distance between peaks, is the mean RR and n is the total number of intervals.
| Variable (Time domain) | Description | relation |
| NN mean* | Average NN intervals | |
| SDNN* | Standard deviation of all NN intervals | total variability / sympathetic |
| SENN | Standard error | |
| SDRR | Standard deviation of all RR intervals | total variability |
| SDANN | Standard deviation of the average of NN intervals in all 5 min segments | total variability |
| SDNN index (SDNNI) | Mean of the standard deviation of all NN interval for all 5 min segments | |
| SDSD | Standard deviation of differences between adjacent NN intervals | |
| NN50 count | Number of pair of adjacent NN intervals differing by more than 50 ms in the entire recording | parasympathetic |
| PNN50* | NN50 count divided by the total number of all NN interval | parasympathetic |
| HR max- HR min | Average differences between highest and lowest HR during each respiratory cycle | |
| RMSSD* | The root mean square of differences between adjacent NN intervals | parasympathetic |
| HRV triangular index | Total number of all NN interval divided by the height of the histogram of all NN intervals | total variability |
| HTI | Reciprocal of probability of the highest bin of histogram of NN intervals | |
| TINN | Baseline width of the histogram of all NN intervals | |
| Differential index | Differences between the widths of the histogram of differences between adjacent NN intervals measured at selected heights. | |
| Logarithmic index | Best approximation of the histogram of absolute differences between adjacent NN intervals. |
Table 6. Different variables in Time domain used for HRV analysis. (*) shows variables that are used in emotion studies.
Frequency domain features
Power spectrum analysis of HRV is a non-invasive valuable descriptor of ANS control functions [2]. Therefore, tracking dynamic changes of HRV by power spectrum density (PSD) is essential. There are several approaches for this purpose, some of commonly used ones are listed below particularly for HRV.
o Three approaches are used to estimate power spectrum density (PSD):
- Compute the power spectrum directly from the RR-interval time series.
- Resample RR-interval time series with different interpolation methods.
- Use an integral pulse frequency modulation (IPFM) model.
o PSD estimation methods of HRV [3]
- Spectrum of Counts (SPC)
- Low-Pass Filtered Event Series
- DFT of the Sequences
- Lomb Method
- Berger Method
- DFT of Interpolated Signals
- AR Method of Interpolated Signals
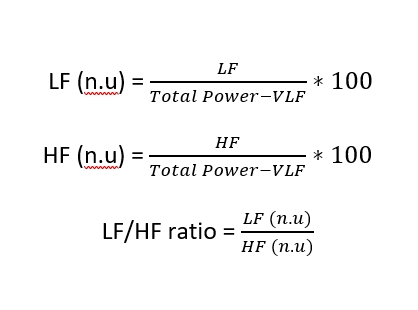
After PSD estimation, the frequency domain parameters of HRV can be calculated (table 7). The frequency components of HRV can be assessed by power spectrum calculation of RR intervals. In short-term recordings (5-min) it is possible to distinguish three main spectral components: very low frequency (VLF) band between 0.0033 and 0.04 Hz, low frequency (LF) band between 0.04 and 0.15 Hz and high frequency (HF) band between 0.15 and 0.4 Hz. The representation of LF and HF in normalized units (n.u) emphasizes the control and balanced behaviour between the two branches of the autonomous nervous system, so that HF derives from vagal activity or the PNS, and LF derives from sympathetic activity. In long-term recordings, such as a 24h period, the result of spectral analysis includes an ultra-low frequency (ULF) component [4]. The below equations show LF/HF ratio reflects the Sympathovagal balance, which significantly boosts categorization of mental physical stress [5].
| Variable (frequency domain) | Description | relation |
| Total power | Variance of all NN intervals | total variability |
| VLF | Power in very low frequency range 0.003 – 0.04 Hz | Sympathetic |
| LF* | Power in low frequency range 0.04 – 0.15 Hz | Sympathetic/parasympathetic |
| HF* | Power in high frequency range 0.15 – 0.4 Hz | parasympathetic |
| ULF* | Power in very ultra-low frequency range | |
| LF norm* | Normalized LF | Sympathetic |
| HF norm* | Normalized HF | parasympathetic |
| SVI* | “Sympathovagal balance” index Ratio LF / HF | Sympathetic / parasympathetic |
| SMI | Sympathetic modulation index LF/(HF+LF) | Sympathetic |
| VMI | Vagal modulation index HF/(LF+HF) | parasympathetic |
| α | Slope of the linear interpolation of the spectrum in a log-log scale |
Table 7. Different variables in frequency domain used for HRV analysis. (*) shows variables that are used in emotion studies.
Non-linear features
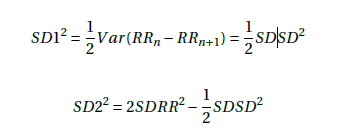
Due to complex dynamics of the heartbeat, HRV analysis in time and frequency domains are not sufficient. Since nonlinear interaction of ANS, analysis of HRV in the nonlinear domain elicits valuable information to determine autonomic balance performance[111]. In table 8, some of vastly used nonlinear variables are shown. Here two important nonlinear variables, SD1 and SD2, is formulated.
Further description of HRV non-linear variable can be found in [31, 109, 112, 113].
| Variable (nonlinear) | Description | relation |
| S | Area of ellipse which represent total HRV | |
| SD1* | Standard deviation of points perpendicular to the axis of line of identity | parasympathetic / ANS |
| SD2* | Standard deviation of points along the axis of line of identity | Sympathetic / parasympathetic / ANS |
| SD1/SD2 | Ratio SD1 / SD2 | |
| ApEn* | Approximate entropy, measures regularity and complexity of time series | |
| SampEn | Sample entropy, measures regularity and complexity of time series | |
| DFA α1 | Detrended fluctuation analysis, short term fluctuation | |
| DFA α2 | Detrended fluctuation analysis, long term fluctuation | |
| D2 | Correlation dimension, estimate minimum number of variables required to construct model of system dynamic | |
| Lyapunov exponents | ||
| Kolmogorov entropy | ||
| 1/f scaling of Fourier spectra [31] | ||
| H scaling exponent [31] | ||
| Coarse Graining Spectral Analysis (CGSA) [31] |
Table 8. non-linear variables used for HRV signal. (*) shows variables that are used in emotion studies.
Feature selection related to mental state monitoring
Beings inherently sociable, human beings use emotions as fundamental ways to communicate. Humans need to express emotions in order to survive and create bonding among themselves. Social interaction is very related to emotion regulation abilities. In addition, self-reporting information is not so reliable and exact that can be used alone for research works. Whether healthy or not, there are some people who are not able to distinguish or express their feelings. Although particularly some disorders such as ADHD, Parkinson’s, and social-emotional agnosia directly effect on emotions.
When it comes to emotion, the ANS is viewed as a major component. Besides, ANS has a role of regulate the heart rate so HRV has gained a currency as a new method to assess ANS function.
Three aspects of human emotion are investigated in research works: arousal, valence and dominance[114]. In this study by using a real and a virtual museum just by HRV tracking to investigate cardiovascular dynamics during high and low arousing, it has been concluded that the accuracy of arousal recognition is 70.39%. the HRV signal has been extracted using Pan-Tompkins’ algorithm. Additionally, after detrending by smoothness prior method, Kubios HRV software is used to correct the ectopic beats of HRV. In real museum scenario 3 features of frequency, i.e., HF peak, HF power n.u. and HF power%, domain were the most dominant by using SVM. So vagal activity is assumed to be the most important item to determine arousal. Also, some nonlinear features including SampEn, ApEn and DFA α1 contributed to detection power. However, in virtual scenario classification of arousal only by using cardiovascular dynamics is challenging[114].
Virtual Reality (VR) has gained a currency in recent years in different fields. Among this fields are treatment applications such as social phobias and also as an emotion elicitation method. Because it can generate environments similar to the real world.
Although HRV is a non-invasive tool to assess cardiovascular dynamics regulation by ANS and different emotions like physical or mental stress affects the function of ANS, it has been shown that HRV is not adequate to achieve the best classification[115]. There are some other physiological signals which are impressed by ANS including EDA, PPG and skin temperature (SKT). Combining the time, frequency and non-linear features of these different biosignals could lead in the best result of stress level examination[115]. Accordingly, in this study by using Kernel-based Extreme Learning Machine (K-ELM) classification method, it is reported that in order to discriminate different levels of stress, these features acquired great accuracy of mean 95.3% for 5 levels of stress.
There are two types of autonomous nervous systems: parasympathetic Nervous System (PNS) and Sympathetic Nervous System (SNS). PNS is responsible for slowing heart rate down, while conversely, SNS quickens the heart rate, so we call them antagonists. In the result of these functions, the heart rate fluctuates around the baseline, i.e., the mean heart rate. By measuring these fluctuations, the function of PNS and SNS can be examined, since they regulate the heart rate in concordance with response to external stressors. Perception of different situations is subjective. For example, in one situation one may perceive it as a joyful situation and feel happy, while it might make another person feel sad. Consequently, finding an efficient way to measure emotions objectively is entailed. HRV is an imperative biomarker which is regulated by ANS when the balance of body system is disrupted.
Many researches have investigated the emotion monitoring and prediction from HRV, most of which have utilized showing video clips as emotion stimulation [116].
After calculation of power spectral density, HF (High Frequency) and LF (Low Frequency) components are obtained. Also, SDNN (Standard Deviation of NN intervals), SDSD (Standard Deviation of RR interval differences), RMSSD (Root Mean Square of successive RR interval differences) and PNN50 (The percentage of adjacent of NN intervals that differ from each other by more than 50 ms).
[117] The goal of this study was to see how virtual reality exergaming experiences are linked to autonomic nervous system responses as an engaging alternative to traditional physical activity workouts. They used an open-source Python library for preprocessing, and Kubios software for HRV analysis. The mean RR interval, mean HR, SDNN, and RMSSD were included as time domain variables. The LF and HF components were chosen for frequency domain analysis. The stress index (SI) of Belsky was also evaluated.
To identify significant differences in HRV measurements between different conditions, a one-way analysis of variance (ANOVA) was used separately. The ratio LF/HF increased twice as much in in the game playing group as it did in the control group, indicating sympathetic activation.
The stimulation of the parasympathetic branch of the ANS was most noticeable at lower difficulty levels. Higher-intensity gaming, on the other hand, was found to cause less parasympathetic recovery during post-exercise and resting times.
[114] The goal of this research is to create an emotion detection system that can automatically distinguish between affective states elicited by an immersive virtual environment.
The artefacts were removed using the Kubios software’s threshold base artefacts correction technique. The QRS detection technique developed by Pan and Tompkins was employed. The smoothness before detrending method was used to extract the distinct trend components.
Mean RR, STDN, RMSSD, PNN50, TINN, RR triangular index, total power, VLF, LF, HF, approximate entropy, sample entropy, DFA, correlation dimension, Pointcaré SD1, and Pointcaré SD2 features were extracted. They used PCA to reduce the features from 29 to 3 and then classified them by SVM recursive feature elimination.
[119] studied physiological responses to a stressful virtual reality environment. RMSSD, HR, and LF/HF ratio features were extracted. The results showed that RMSSD was increased, and the LF-HF ratio was decreased in the stressor group compared to the control group. It is unclear why they observe this pattern of responses!
In this study, [118], the following features were extracted for categorizing emotions into two-dimensional states (positive and negative): mean RR, standard deviation RR, ratio (mean RR/STD RR), VLF, HF, LF, ratio LF/HF, mean magnitude, phase entropy, normalized bispectral entropy, normalized bispectral squared entropy, sum of logarithmic bispectral amplitude, non-linear sympatho-vagal interaction, min and max and mean of wavelet. Six features coming from Wavelet were used.
References
[1] T. F. o. t. E. S. o. C. t. N. A. S. o. P. Electrophysiology, “Heart rate variability: standards of measurement, physiological interpretation, and clinical use,” Circulation, vol. 93, no. 5, pp. 1043-1065, 1996.
[2] K. Li, H. Rüdiger, and T. Ziemssen, “Spectral analysis of heart rate variability: time window matters,” Frontiers in neurology, vol. 10, p. 545, 2019.
[3] J. Mateo and P. Laguna, “Improved heart rate variability signal analysis from the beat occurrence times according to the IPFM model,” IEEE Transactions on Biomedical Engineering, vol. 47, no. 8, pp. 985-996, 2000.
[4] R. O. Lima, “Autonoumous Nervous System biosignal processing via EDA and HRV from a wearable device,” 2018.
[5] W. von Rosenberg, T. Chanwimalueang, T. Adjei, U. Jaffer, V. Goverdovsky, and D. P. Mandic, “Resolving ambiguities in the LF/HF ratio: LF-HF scatter plots for the categorization of mental and physical stress from HRV,” Frontiers in physiology, vol. 8, p. 360, 2017.
[6] M. F. de Godoy, “Nonlinear analysis of heart rate variability: a comprehensive review,” Journal of Cardiology and Therapy, vol. 3, no. 3, pp. 528-533, 2016.
[7] F. Shaffer and J. P. Ginsberg, “An overview of heart rate variability metrics and norms,” Frontiers in public health, p. 258, 2017.
[8] A. Verma, S. Cabrera, A. Mayorga, and H. Nazeran, “A robust algorithm for derivation of heart rate variability spectra from ECG and PPG signals,” in 2013 29th Southern Biomedical Engineering Conference, 2013, pp. 35-36: IEEE.
