Content
- Electrocardiogram (ECG)
- 1.Waves and characteristics
- A single beat wave description
- Signal characteristics
- 1.Waves and characteristics
1- Electrocardiogram (ECG)
The electrocardiogram (ECG or EKG) is a non-invasive method of recording the electrical activity of the heart and illustrates cardiac electrophysiological characteristics. Contraction and relaxation of myocardial muscle lead to depolarization (activation) and repolarization (recovery) of the heart, which transmits electric fields through our body as a volume conductor. These currents can be detected by sensors placed on the surface of the body and recorded as an ECG signal. As it is depicted in figure 1, each wave (myocardial action potential) derives from a specific region of cardiac muscle and contributes to a single beat formation. An electrical impulse is sent out by the SA node (also known as the heart’s pacemaker). The atria (upper heart chambers) contracts. An impulse is sent into the ventricles by the AV node. Finally, the important part of heart’s electrical conduction system comprised of common bundle (His bundle) and its left and right bundle branches leading to the purkinje fiber networks, through which electrical impulses are transmitted to the bottom chambers of the heart (ventricles), gives rise to the ventricles to contract or pump blood.

Figure 1. Relationship between regional cardiac electrical activity and the surface ECG[1].
1.1. ECG Waves and characteristics
ECG signals have some basic and measurable characteristics associated with them, which are also known as intrinsic features like amplitude, frequency facts and wavelet information. The study of these electrical impulses and their features allows us to gain a better understanding of how the heart works, and for that we should interpret the signal. ECG interpretation means to check whether the ECG waves and intervals are normal. In this section, the wave morphology, durations, and intervals are described as ECG characteristics.
1.1.1. A signal beat wave description
A normal heartbeat represents an ECG complex which is composed of three main waves: P, QRS complex, which includes Q, R and S waves, and T (figure 2). Each wave represents particular characteristics of myocardial electrical change during a single beat.

Figure 2. Morphology of a normal ECG (ECG & Echocardiography Education 2021)
1.1.2. Signal characteristics
In addition to the mentioned waves, time interval between waves is an important criterion by which normal function of heart can be determined. These intervals are also shown in fig.2. The characteristics of waves and intervals including amplitude and duration are shown in table 1.
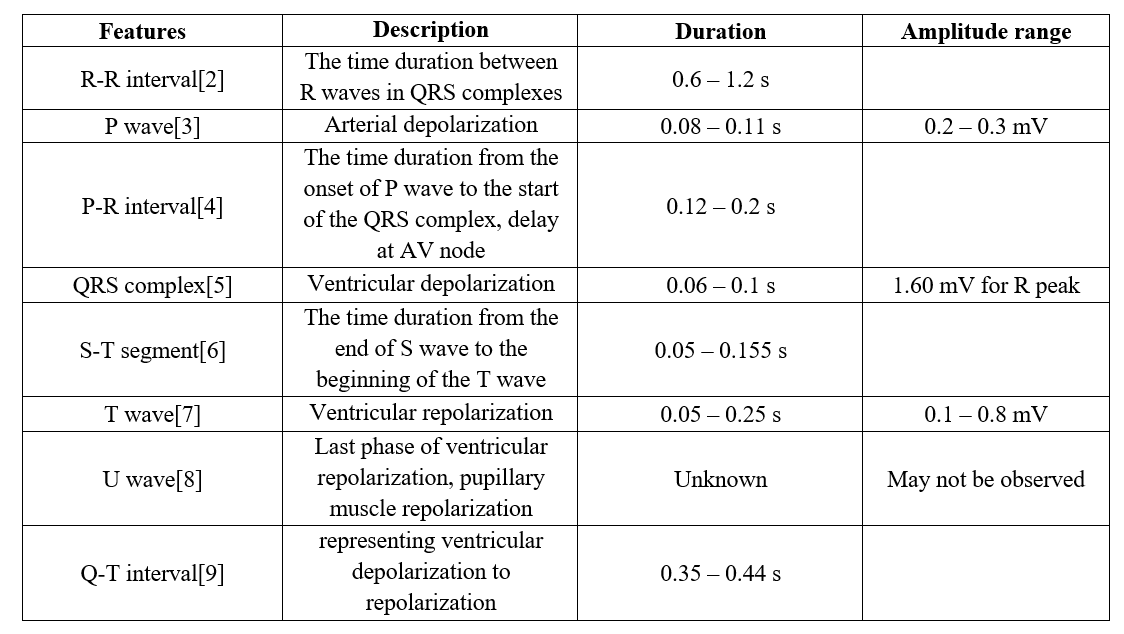
Table 1. the characteristics of ECG waves and intervals
[1] H. F. Jelinek, D. J. Cornforth, and A. H. Khandoker, ECG time series variability analysis: engineering and medicine. CRC Press, 2017.
[2] A. Adami et al., “Electrocardiographic RR Interval Dynamic Analysis to Identify Acute Stroke Patients at High Risk for Atrial Fibrillation Episodes During Stroke Unit Admission,” Translational Stroke Research, vol. 10, no. 3, pp. 273-278, 2019/06/01 2019.
[3] H. Pürerfellner et al., “P-wave evidence as a method for improving algorithm to detect atrial fibrillation in insertable cardiac monitors,” Heart Rhythm, vol. 11, no. 9, pp. 1575-1583, 2014.
[4] M. Montalvo et al., “PR interval prolongation and cryptogenic stroke: a multicenter retrospective study,” Journal of Stroke and Cerebrovascular Diseases, vol. 26, no. 10, pp. 2416-2420, 2017.
[5] J. J. Bax et al., “Prognostic implications of left ventricular global longitudinal strain in heart failure patients with narrow QRS complex treated with cardiac resynchronization therapy: a subanalysis of the randomized EchoCRT trial,” European heart journal, vol. 38, no. 10, pp. 720-726, 2017.
[6] D. J. Hausenloy et al., “Targeting reperfusion injury in patients with ST-segment elevation myocardial infarction: trials and tribulations,” European heart journal, vol. 38, no. 13, pp. 935-941, 2017.
[7] T. Nakagawa et al., “Differences between cardiac memory T wave changes after idiopathic left ventricular tachycardia and ischemic T wave inversion induced by acute coronary syndrome,” Journal of Electrocardiology, vol. 49, no. 4, pp. 596-602, 2016/07/01/ 2016.
[8] A. R. P. Riera et al., “The enigmatic sixth wave of the electrocardiogram: the U wave,” Cardiology journal, vol. 15, no. 5, pp. 408-421, 2008.
[9] B. J. Hermans et al., “Improving long QT syndrome diagnosis by a polynomial-based T-wave morphology characterization,” Heart Rhythm, vol. 17, no. 5, pp. 752-758, 2020.
